
Your KPIs aren’t dead - They’re on life support.
Here’s the treatment plan.
AI is moving the goalposts every quarter. Your dashboard is still measuring last season’s game. And the people inside it are losing motivation trying to win a match that no longer exists.
I sat in a boardroom recently watching a leadership team present their performance metrics to their directors. Seventeen KPIs. Every number green. Every target hit. The board nodded politely. Someone used the word “momentum.”
I looked around the room at the team who had delivered those numbers. Not one of them looked like a group who believed they were winning.
That is the life-support moment. Not when the numbers go red. When the numbers stay green and the people go quiet.
Here is what was actually happening in that room. Fourteen of those seventeen metrics were measuring activities that AI had quietly absorbed in the previous nine months. The targets had been set for a workforce doing tasks now performed faster, cheaper, and without lunch breaks by software. The humans were hitting numbers designed to measure a version of their work that no longer existed. And somewhere in the gap between the green dashboard and the hollow feeling in the room, motivation had leaked away almost entirely. 01
Your KPIs are not dead. But they are stuck. And in a world moving this fast, stuck is the first stage of terminal.
The treatment is not a new dashboard. It is a new architecture — three measurement frameworks working together that most organisations are currently running with only one of. I think of them as the Three Musketeers of measurement. One for all, all for one. Each one weaker without the other two.

01 · THE DIAGNOSISWhy your KPIs got stuck
Key Performance Indicators were built on one assumption that nobody questioned, because for most of business history it was true: that you could set a target, map a path to it, and the world would hold still long enough for the measurement to be useful.
That assumption is now structurally false.
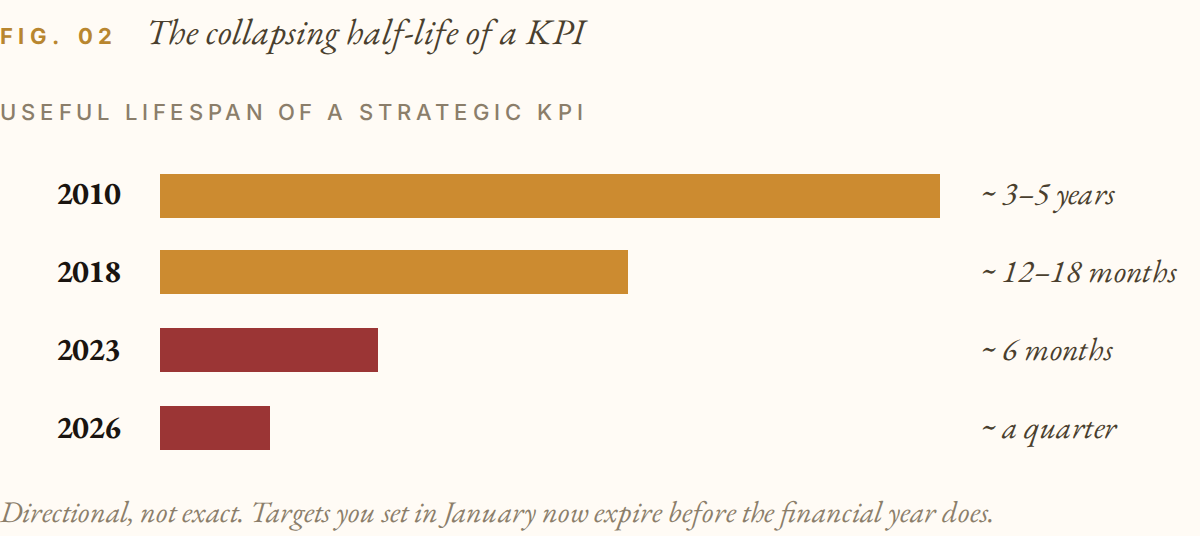
AI is not just changing how work gets done. It is changing what work needs doing, what skills are required to do it, what success looks like when you get there, and how quickly all of those things shift again. The half-life of a KPI — the period during which it is still measuring something real — has collapsed. Targets that made sense in January are measuring a destination that may have moved by June. Paths that were efficient six months ago are being rewritten overnight.
Jensen Huang, CEO of Nvidia, said something at Davos in January 2025 that should be printed on every planning document in every organisation. “The purpose of your job,” he said, “and the tasks and tools that you use to do your job, are related, not the same.” 03
Purpose and tasks. Related. Not the same. Most KPI systems measure tasks. AI is automating tasks. The arithmetic from here is not difficult.
If your measurement system is built around tasks, and the tasks are being absorbed by software, then your measurement system is, by quiet degrees, measuring less and less of what your organisation actually does. Hit your numbers. Lose your meaning. The dashboard stays green. The people go quiet.
This is not a story about reporting cycles. It is a story about structural obsolescence. The annual planning cycle assumes a stable horizon. The horizon stopped being stable about three years ago. Most organisations are still planning as if it were. 04
02 · THE LEARNING LAYERThe KFI — the metric most organisations are missing
Here is the second indicator, and the one most leaders have not yet named.
Failure is the master teacher. Success only confirms what you already knew.
That sentence is the philosophical foundation for the most underused metric in performance measurement: the Key Failure Indicator (KFI). Not a vanity metric of how many things went wrong. A precise measurement of how fast your organisation is converting unsuccessful experiments into actionable conclusions. Learning velocity.
A KPI tells you whether you hit the target. A KFI tells you what you learned when you didn’t. Most measurement systems track the first and silently lose the second.
The most instructive live example of this is a media company most leaders consume but few have studied as a measurement architecture: The Diary of a CEO. The fastest growing podcast in the world. 05 Steven Bartlett has spoken openly about how his organisation operates: experimentation is treated as a measurement layer, not a marketing slogan, and failure rate has been deliberately raised — not minimised — because it is the only honest evidence that real testing is happening. 06
That is what a KFI looks like in practice. Not “we welcome failure” hung on a wall. A weekly metric that names how many experiments ran, how many failed, what each failure produced as conclusion, and what the team did differently as a result. The output of a KFI is not feeling. It is direction.
03 · THE ANCHORThe KPI2 - the indicator that dosent move
The KPI² - the indicator that dosent move
Now the third indicator. And the one that holds the system together.
If KPIs measure the path and KFIs measure how fast you learn when the path moves, the Key Purpose Indicator (KPI² pronounced “KPI squared”) measures whether the destination was ever worth the journey. Progress toward the purpose that doesn’t change even when everything else does.
The notation is deliberate. KPI² is not KPI plus something. It is KPI elevated — the same measurement instinct operating on a different dimension. Performance squared by purpose. Without that second dimension, you are measuring motion. With it, you are measuring meaning.
Every organisation has a purpose. Most have it written on a wall somewhere and ignored everywhere else. The exercise to find it is simple and uncomfortable: lock your leadership team in a room and ask them to describe in a single sentence what the organisation actually exists to create. Not the mission statement version. The honest version. The one they would give if the board was not in the room and the answer actually had to be true.
When you have that sentence, you have your anchor. Every KPI² traces a direct line back to it. If a metric cannot trace that line, it does not belong on your dashboard.
Most measurement reinventions renovate. They add an outcome metric here, retire a vanity metric there, and call it transformation. It is not transformation. It is renovation of a building with a structural fault.
That is how the Three Musketeers work as a system — architectural rather than cosmetic. It starts from purpose, builds the learning layer that catches what KPIs miss, and lets the existing performance metrics do the narrower job they were always meant to do.
04 · THE TREATMENT PLANFive moves to get off life support
I have run this process with organisations across industries. The sequence matters. Skip a step and you are redesigning the dashboard without fixing what the dashboard is for.
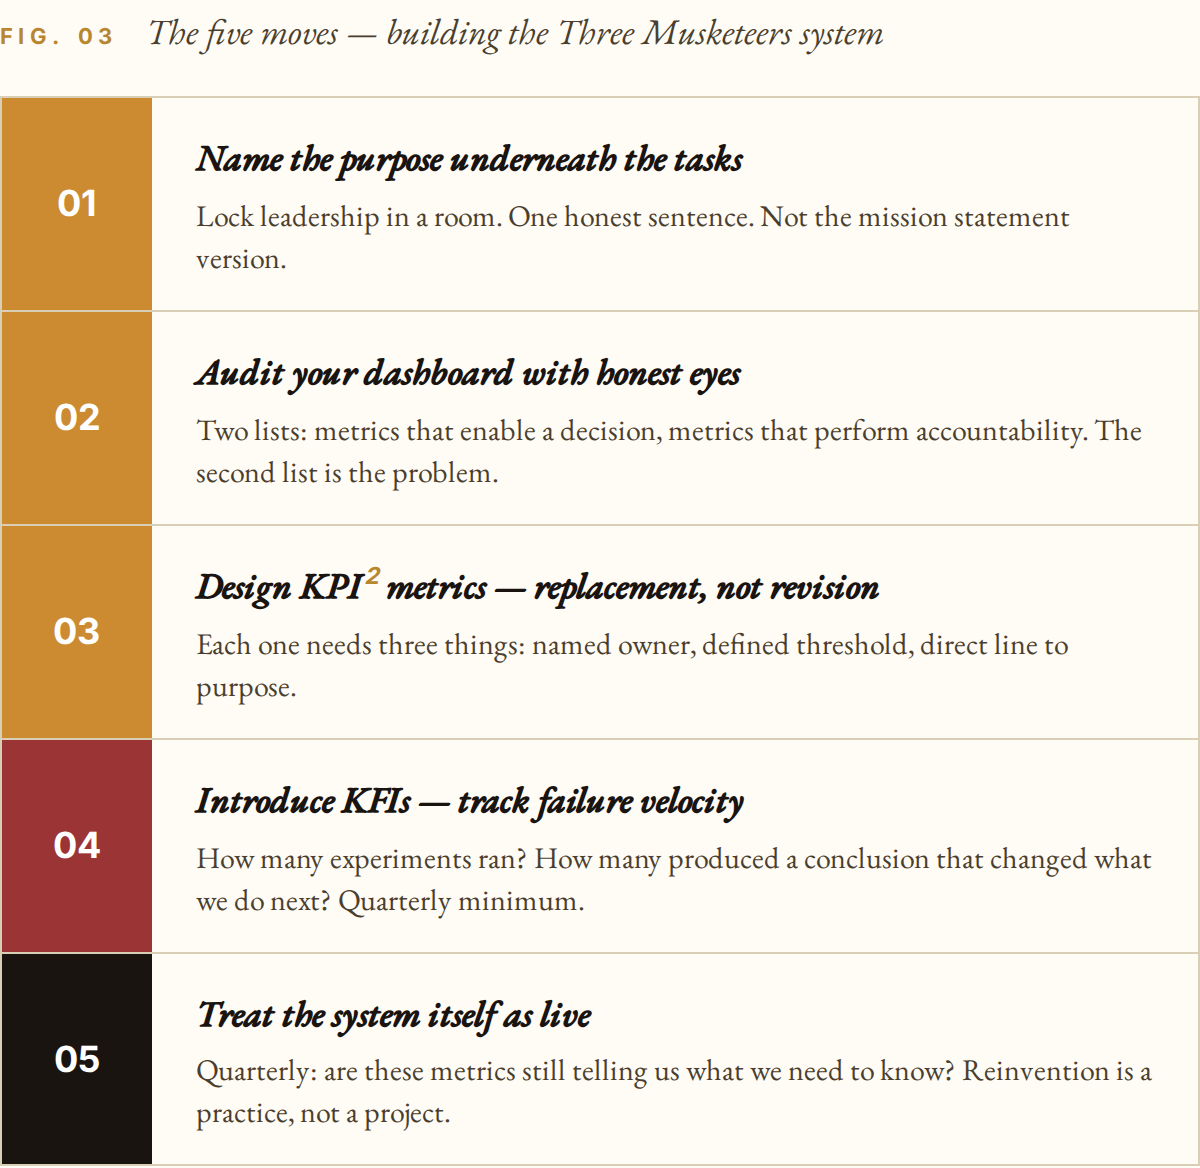
Name the purpose underneath the tasks
Before you touch a single metric, answer the honest question. What does your organisation actually exist to create? Not the polished version. The version your best people care about most when the quarterly pressure is off. That sentence is your foundation. Every metric you build from here traces a direct line back to it. If it cannot trace that line, it does not belong on your dashboard.
Audit your dashboard with honest eyes
Pull up every metric you currently track. For each one, ask: does this enable a decision, or does it perform accountability for an audience? I worked with one team who discovered they had been tracking a customer-satisfaction metric for four years that had not informed a single decision in that time. It went up, it went down. Nobody ever acted on it because nobody had ever decided what acting on it would look like. That is not measurement. That is decoration.
Design KPI² metrics — replacement, not revision
Here is where most reinventions fail. Teams add an outcome metric, retire a vanity metric, declare the work done. Architects design differently. Every KPI² needs three things: a named decision owner (a person, not a team), a defined threshold that triggers action, and a direct line of sight to purpose. Without all three, you do not have an indicator. You have a number.
Introduce KFIs — track failure velocity as a core metric
If you take one thing from this article, make it this. Your organisation needs a measure of how fast it is learning from what goes wrong. The question is simple: in the last quarter, how many experiments did we run, and how many generated a conclusion that changed what we do next? That ratio tells you more about innovation capability than any dashboard of launch metrics and R&D spend. Track it weekly if you can. Quarterly if you cannot. Watch what happens to the quality of conversation in the room.
Treat the measurement system itself as live
Reinvention is not a project with an end date. It is a practice. The organisations that build genuine KPI² metrics do not review them annually and call it done — they treat the measurement system itself as something that requires ongoing experimentation. New purpose creates new metrics. Changing conditions make old ones obsolete. Every quarter, the question on the table: are our indicators still telling us what we actually need to know
05 · THE CLOSING ARGUMENTOne for all. All for one.
There is a version of this story that ends with a better spreadsheet. A cleaner dashboard. A new column on the same old report.
That is not the version I am offering.
The Three Musketeers are not a list of frameworks to bolt onto an existing system. They are a relationship. KPIs tell you whether you hit the target. KFIs tell you what you learned when you missed it. KPI² tells you whether the target was worth hitting in the first place. Most organisations have the first. Almost none have the second. And very few have stopped long enough to ask the third.
That is the diagnosis. That is the treatment. And in a world where AI is moving the goalposts every quarter, the organisations that survive will not be the ones with the best targets. They will be the ones with the clearest purpose, the fastest learning, and the courage to admit that the dashboard they built last year was measuring a game that no longer exists.
Your KPIs are on life support. But the patient is not gone. The treatment starts with a question. Not “are we hitting our targets?” — but “are we measuring the right game?”
SOURCE NOTES
01 Boardroom case. Author’s consulting work — composite drawn from three engagements (financial services, B2B SaaS, professional services) between 2024 and 2026, anonymised. Generalisation supported by McKinsey State of AI 2025, which finds 78% of organisations had introduced AI into core workflows but only 12% had revised performance metrics in the same period.
02 Hemingway. Ernest Hemingway, The Sun Also Rises (1926). The exchange between Bill Gorton and Mike Campbell: “How did you go bankrupt?” “Two ways. Gradually and then suddenly.”
03 Huang, Davos. Jensen Huang, CEO of Nvidia, World Economic Forum, Davos, January 2025. Onstage interview discussing AI’s effect on knowledge work.
04 KPI half-life. Directional analysis triangulated against BCG Reinventing Performance Management (2024) and Deloitte Human Capital Trends 2025. No standardised industry measure of “KPI half-life” exists; the Fig. 02 chart conveys shape and trajectory rather than precise quantitative claims.
05 DOAC growth. The Times (UK), June 2025: DOAC reported as the fastest-growing podcast in the world, adding 300,000–500,000 new subscribers per month, with approximately 50 million monthly listeners across platforms.
06 DOAC method. Steven Bartlett, founder of The Diary of a CEO, on multiple public podcast appearances. Bartlett has stated that experiment volume and failure rate are tracked as weekly metrics and that failure rate has been raised “in a dramatic way” as a measurement layer added to conventional performance metrics, not as a replacement.